
The Hidden Cost of an Undocumented Operating Model
The org chart shows how work was meant to flow. How it really flows is usually written down nowhere.
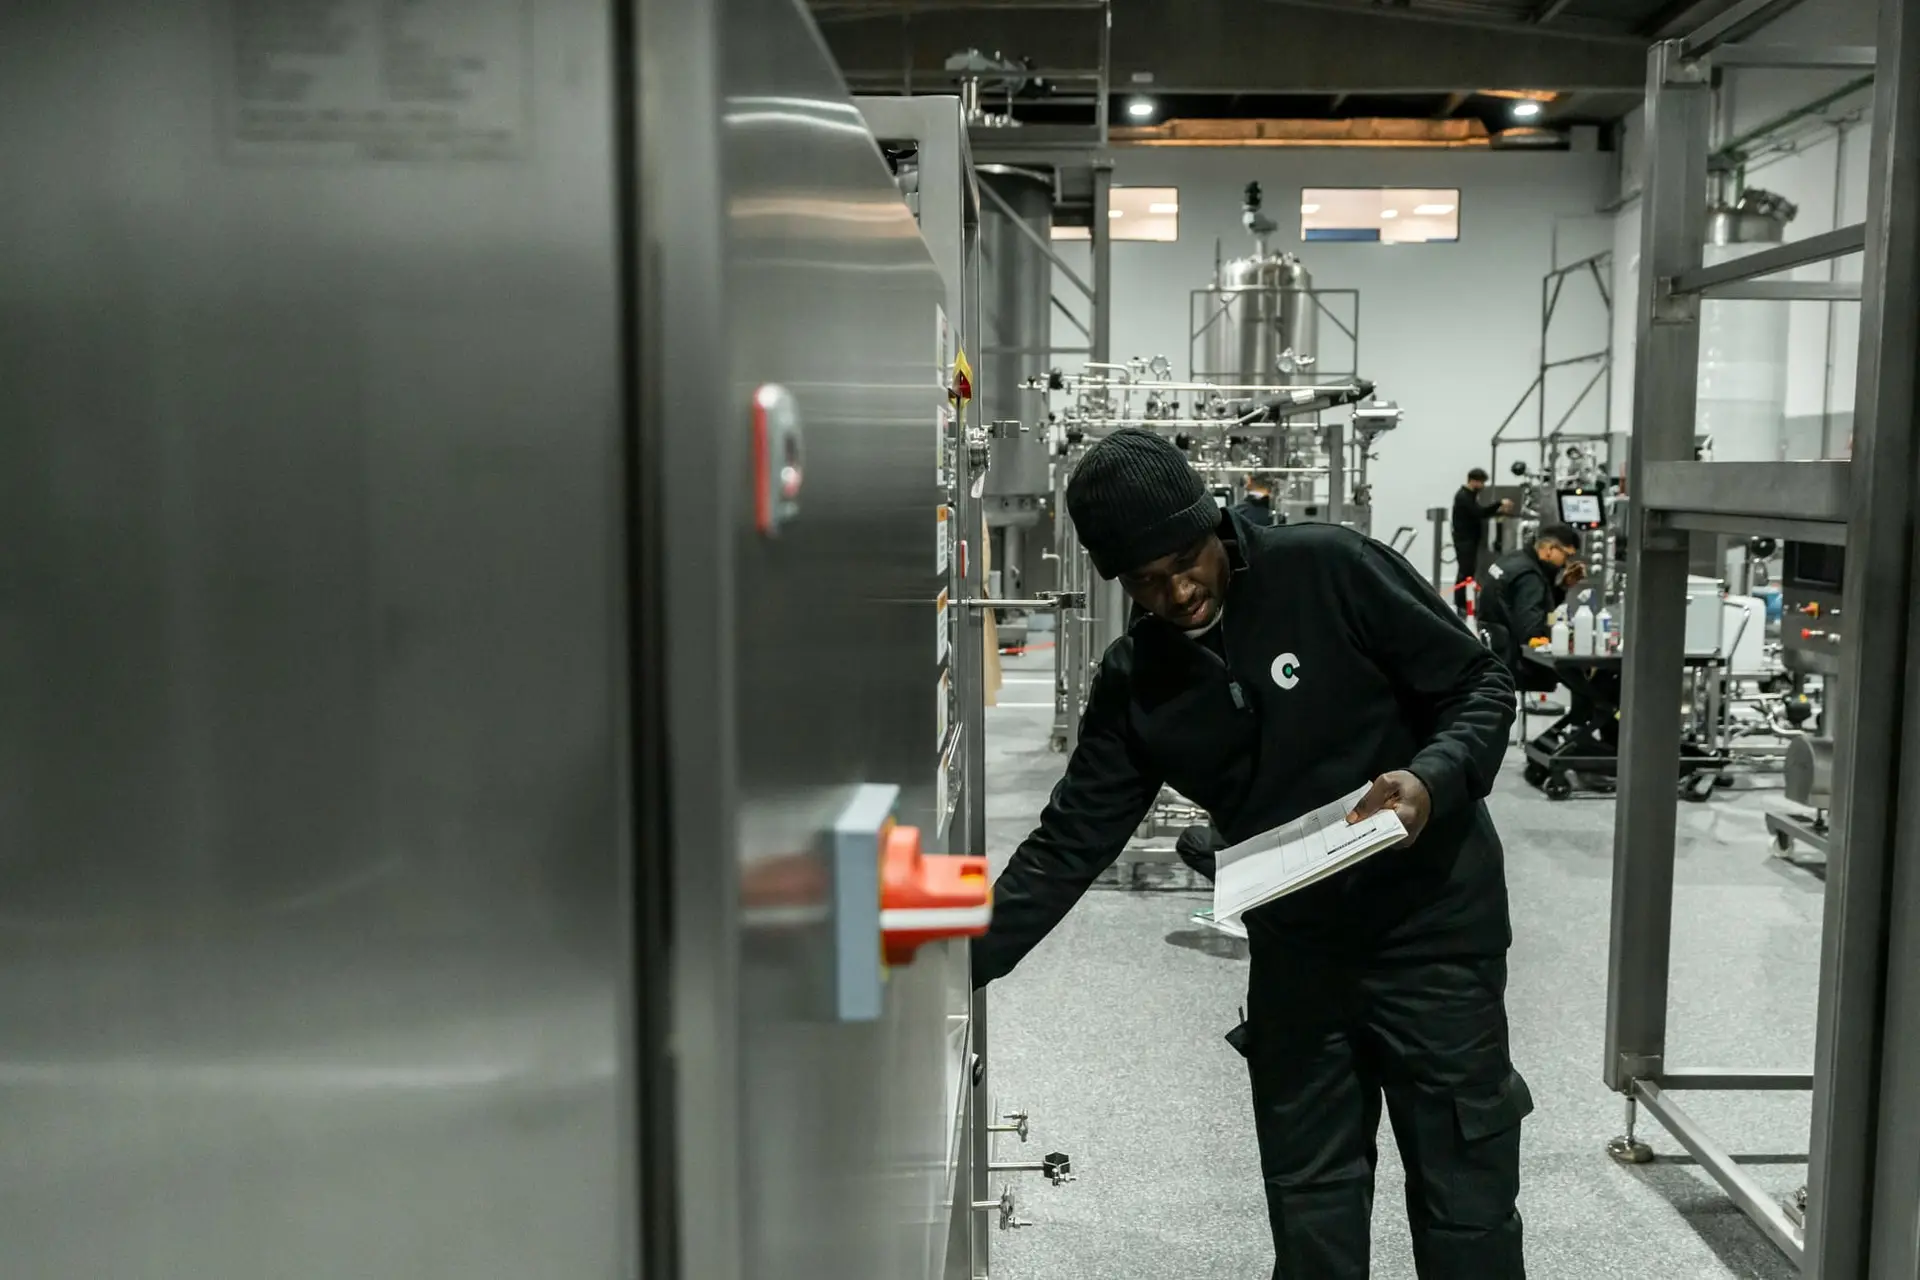
What the org chart cannot show
An organizational chart records reporting lines and process design on the day it was drawn, and from then on people adjust. A machine behaves differently from the manual, a customer needs something faster, a colleague leaves. Each adjustment is sensible when it is made, and none of them is recorded anywhere.
Ask a shift supervisor how the site prioritizes work and the answer will seldom match the procedure, and a second supervisor may not match the first. Leadership usually learns this only when a quality or safety event prompts a formal review.
Why the cost gets blamed on people
When quality slips, the reflex is to benchmark harder, shift against shift and operator against operator. That works if the cause lies inside a shift, and it fails when the cause sits between two of them, because output measures do not look there.
Exhibit 1: Signs that point to a drifted operating model instead of an individual performance problem.
| Sign | Performance problem | Operating-model problem |
|---|---|---|
| Where issues cluster | With particular people or crews | At shift changes or between departments |
| How people describe the process | Consistently, matching the document | Differently from each other and from the document |
| Effect of benchmarking | Scores improve and so does quality | Scores improve and quality does not |
| Decision ownership at handoffs | Clear | Assumed, disputed or missing |
Finding the gap
Observation finds it faster than document review, and a few days of watching work across shifts typically narrows the problem to a specific point. Most often it is one handoff where nobody was ever assigned the decision, and informal habit filled the space inconsistently.
In one composite engagement, a fabrication plant traced its quality variance to the change of shift. A five-minute overlap briefing, piloted for three weeks on one shift pairing, cut handoff-related quality holds by about 45 percent. Read the shift operations case study.
Test before you roll out
A redesign based on observation is still a hypothesis, since every team has its own variant of the workaround and a fix that suits one may not suit another. Running the change with a single team first shows what breaks under real conditions.
The pilot also changes how the rollout is received, because supervisors who have seen peers use the new method treat it as tested practice. The same pattern shows up at the boundary between sales and delivery, which we cover in designing operations around the customer.
Key takeaways
- Ask two supervisors on different shifts to describe how work is prioritized, and compare the answers.
- Plot recent quality issues by where in the workflow they arose, not by who was on duty.
- Spend time on the floor before opening the procedure manual.
- Trial any redesigned handoff with one team before rolling it out.
See how your operation really runs
We can map your operating model from the floor and show where practice has drifted from the documented process.

Rig Move Efficiency Is a Leadership Problem
The gap between a fast rig move and a slow one is set in planning and briefing, well before the first truck arrives.

Designing Operations Around the Customer Experience
Customers do not see departments. They see what happens to their order as it passes between them.

Job Architecture as a Growth Enabler for Acquisitive Firms
Each acquisition brings its own titles and pay bands. By the third or fourth deal, the inconsistencies become an equity problem.